Analysis & Reporting
Hundreds of standards Reports
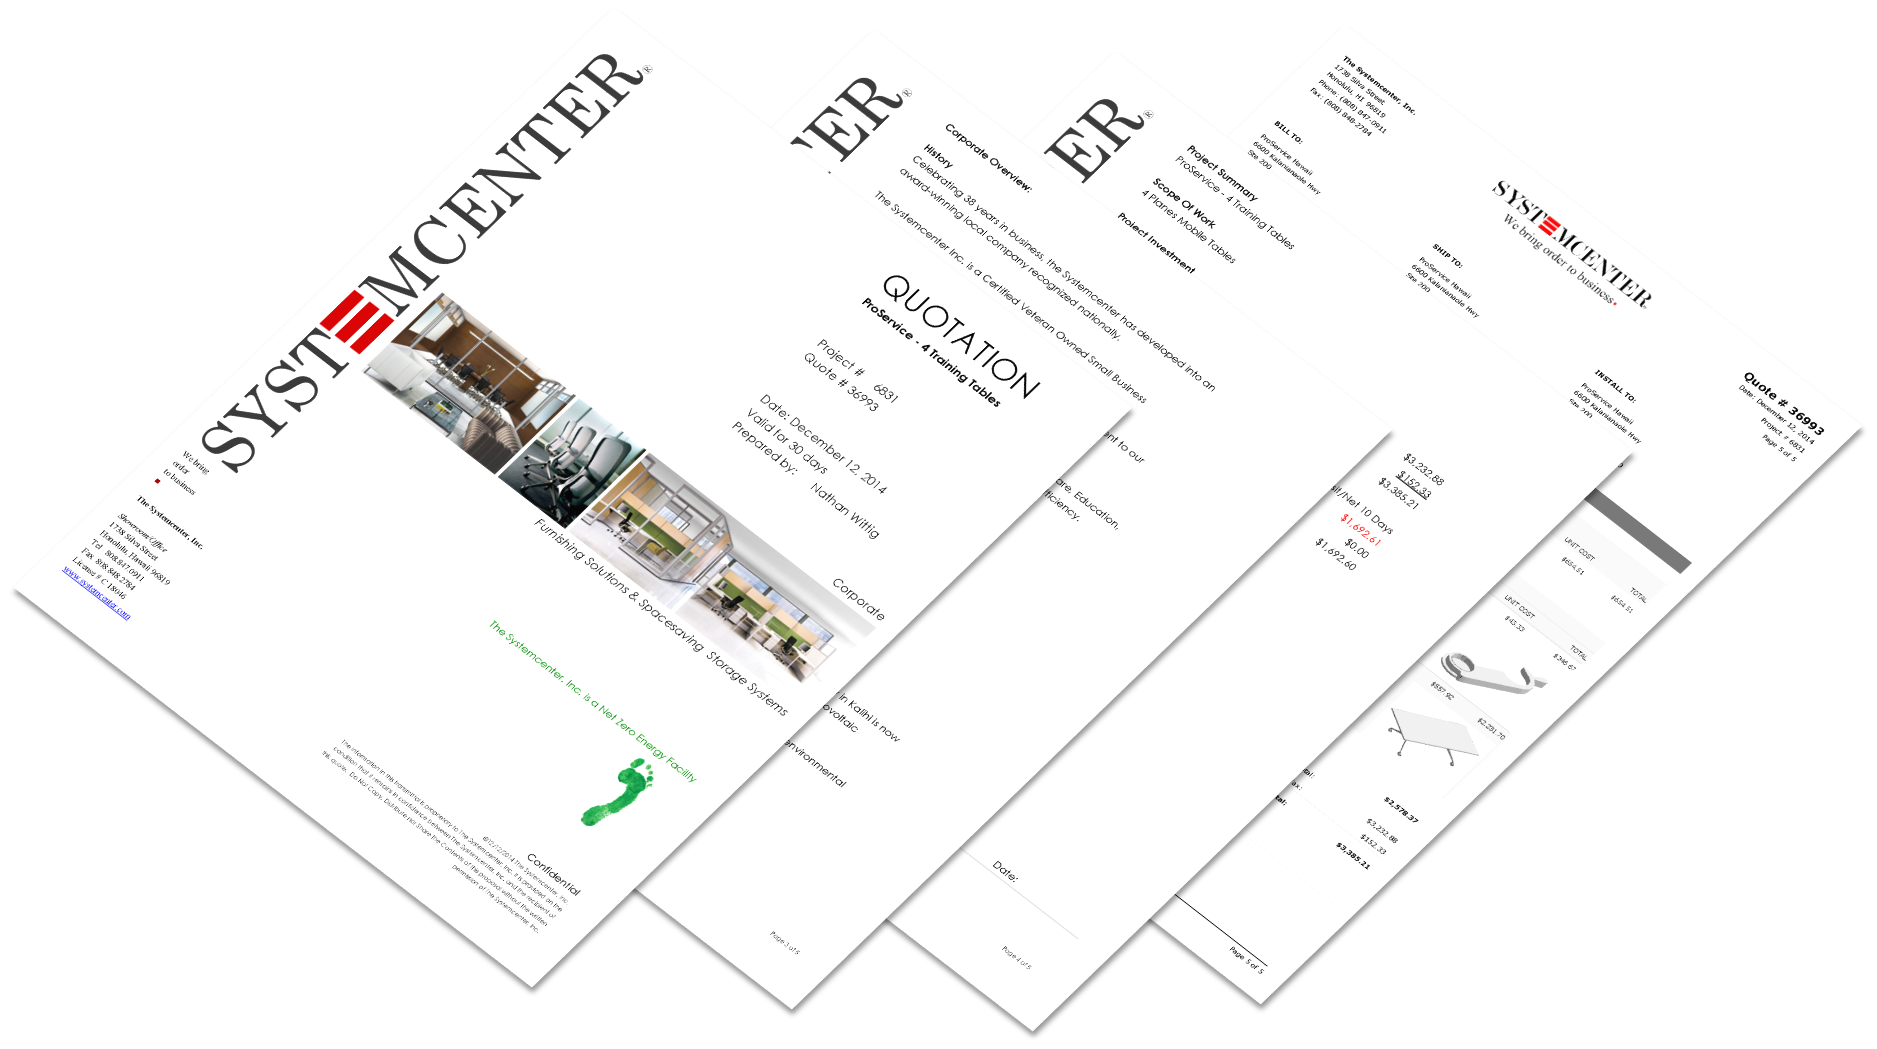
e-manage|ONE has hundreds of standard reports as part of its software package. When a report is in e-manage|ONE, you can immediately email it and automatically save the email with the attached report directly to the project for a complete history. Reports are saved by default to PDF but can be downloaded to your hard drive as MS Word or Excel files.
Built-in Custom Report Designer
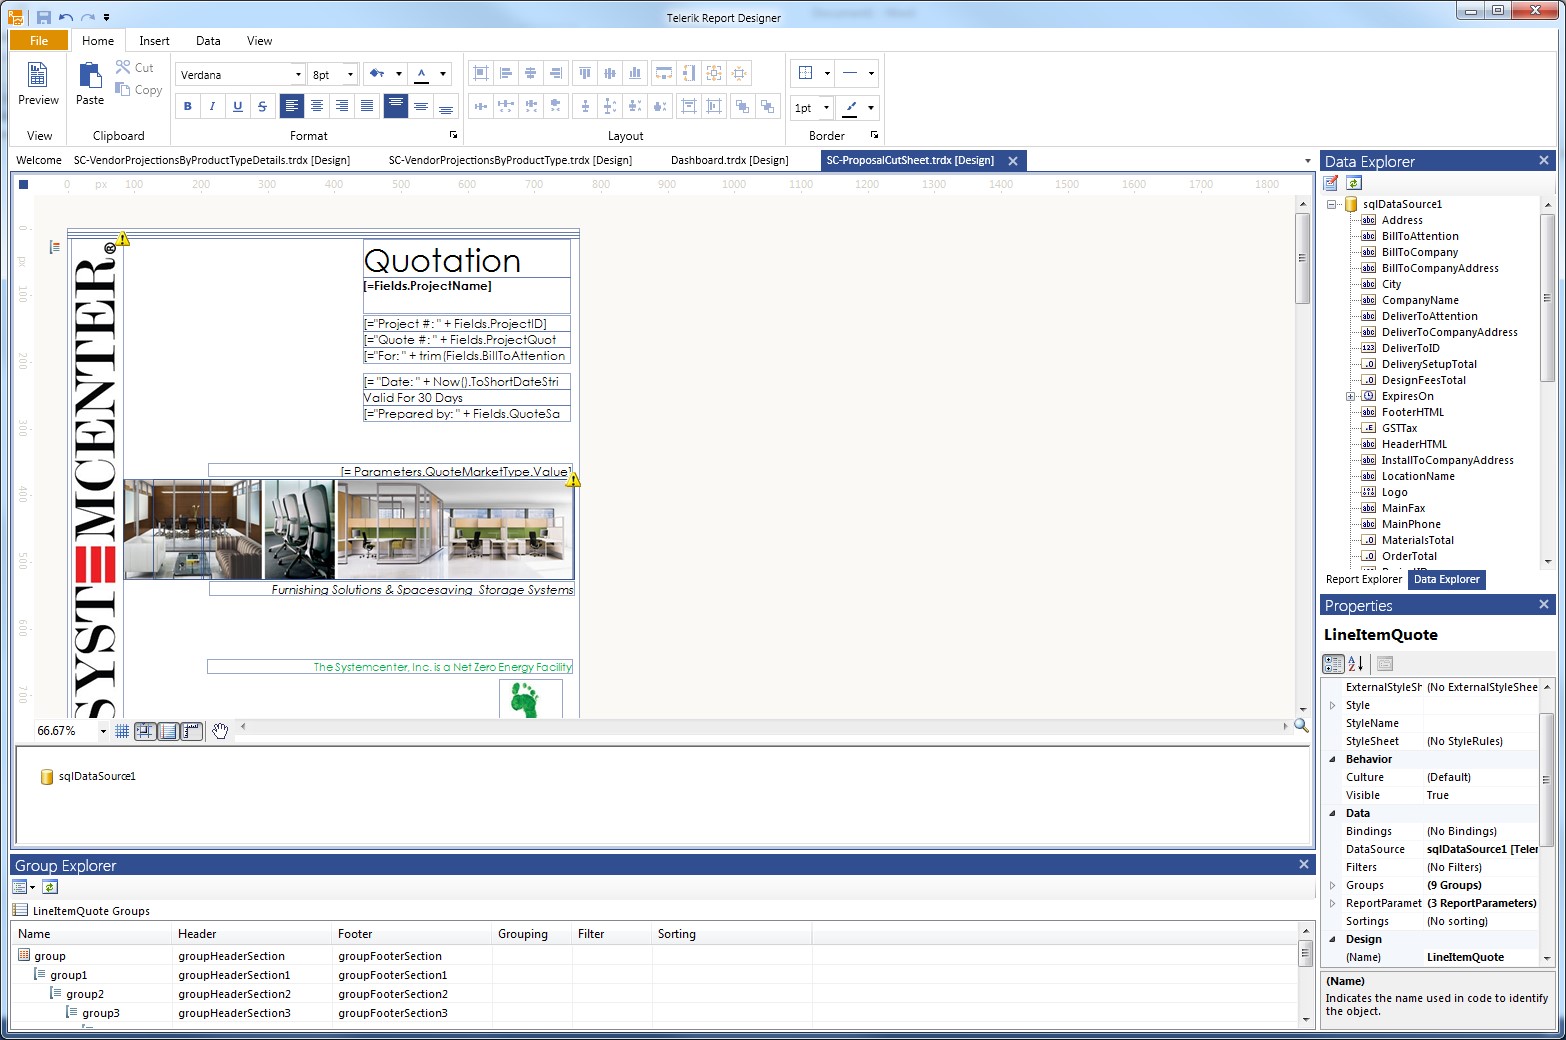
e-manage|ONE has Telerik’s custom report designer built-in to give your business the power to modify any of our standard reports and use them as alternates or create your very own custom reports and use them within e-manage|ONE. There is no need to create third party reports which are run externally.You can assign security right s to your custom reports using the e-manage|ONE users rights profile configurator in the e-manage|ONE Administrator.
Custom Query Builder
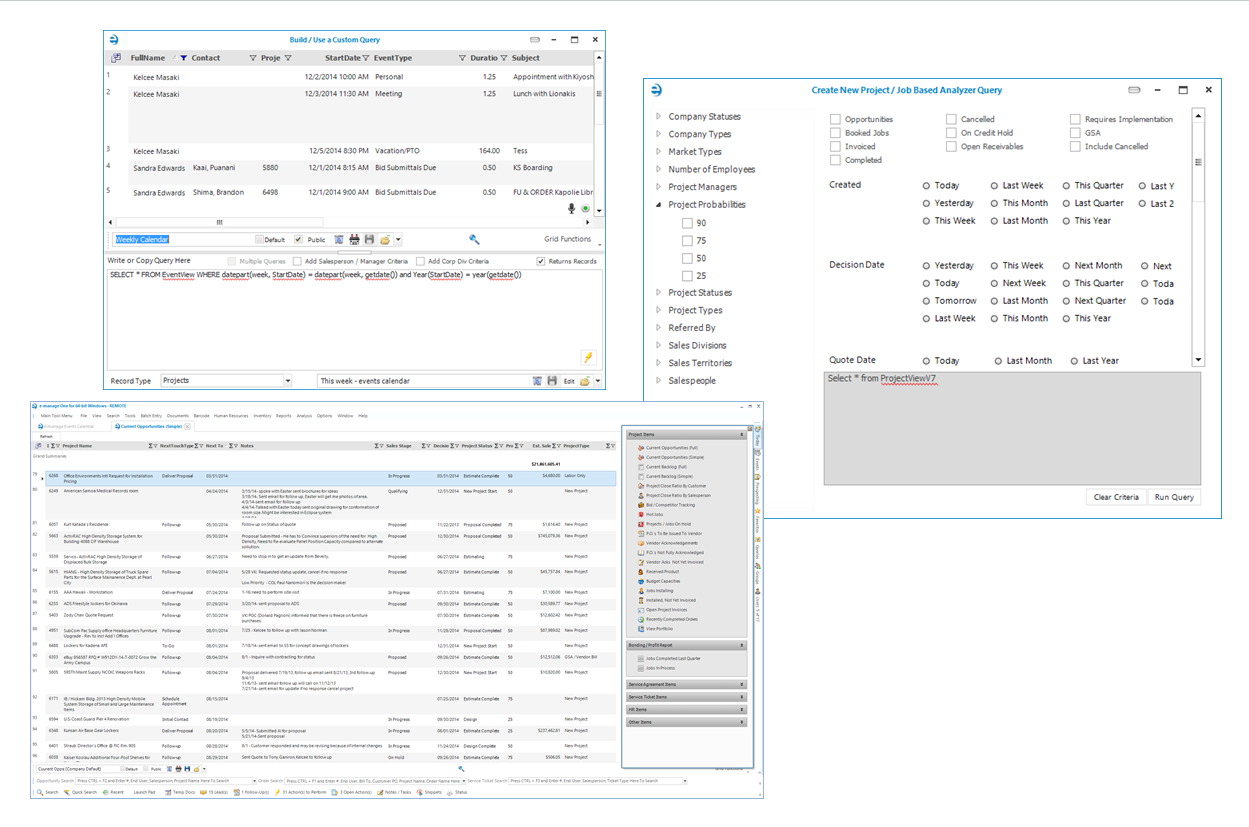
Besides all the standard reports and the custom report designer in e-manage|ONE you can also create your own custom queries which load in a grid for real-time viewing. Grids layouts can be modified and saved with security as favorites and can be exported to Excel.
Dashboard Graphs
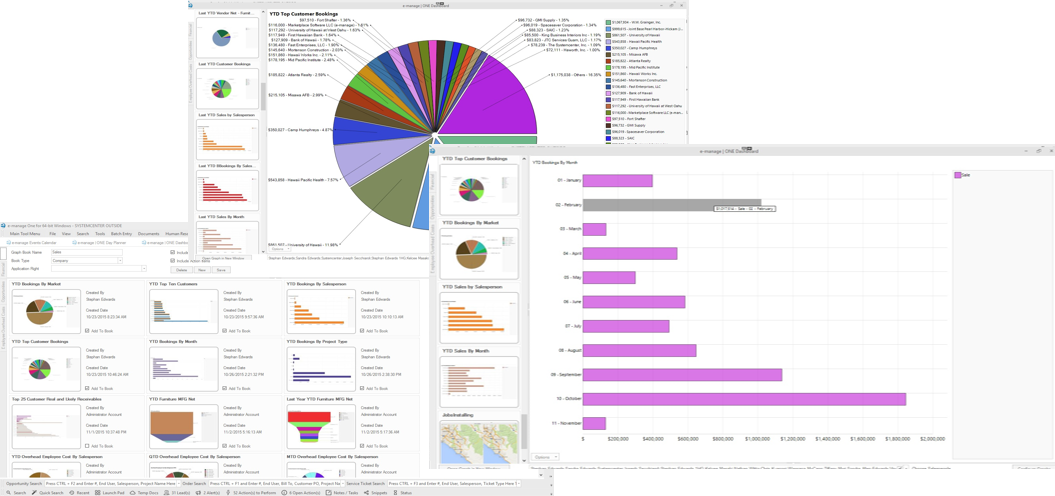
The e-manage | ONE Graphical Analysis Module you won’t find in any other software. It comes with over 80 pre-build graphs and if that is not enough, it is totally customizable and we will help you build more.
We have introduced a variety of graphical dashboards, grids and reports that are standard to help you better track and manage your business. The included dashboards can be customized on your own to your liking or you can create brand new dashboards from scratch with the included Graph Configuration Tool. You can also categorize graphs to be organized how you want them. Graphs can be set by default to include comparison graphs to see side by side detailed information.
